create a clustered column and stacked column charts gor the pre-MBAand post MBA salary data in the accompanying dataset.
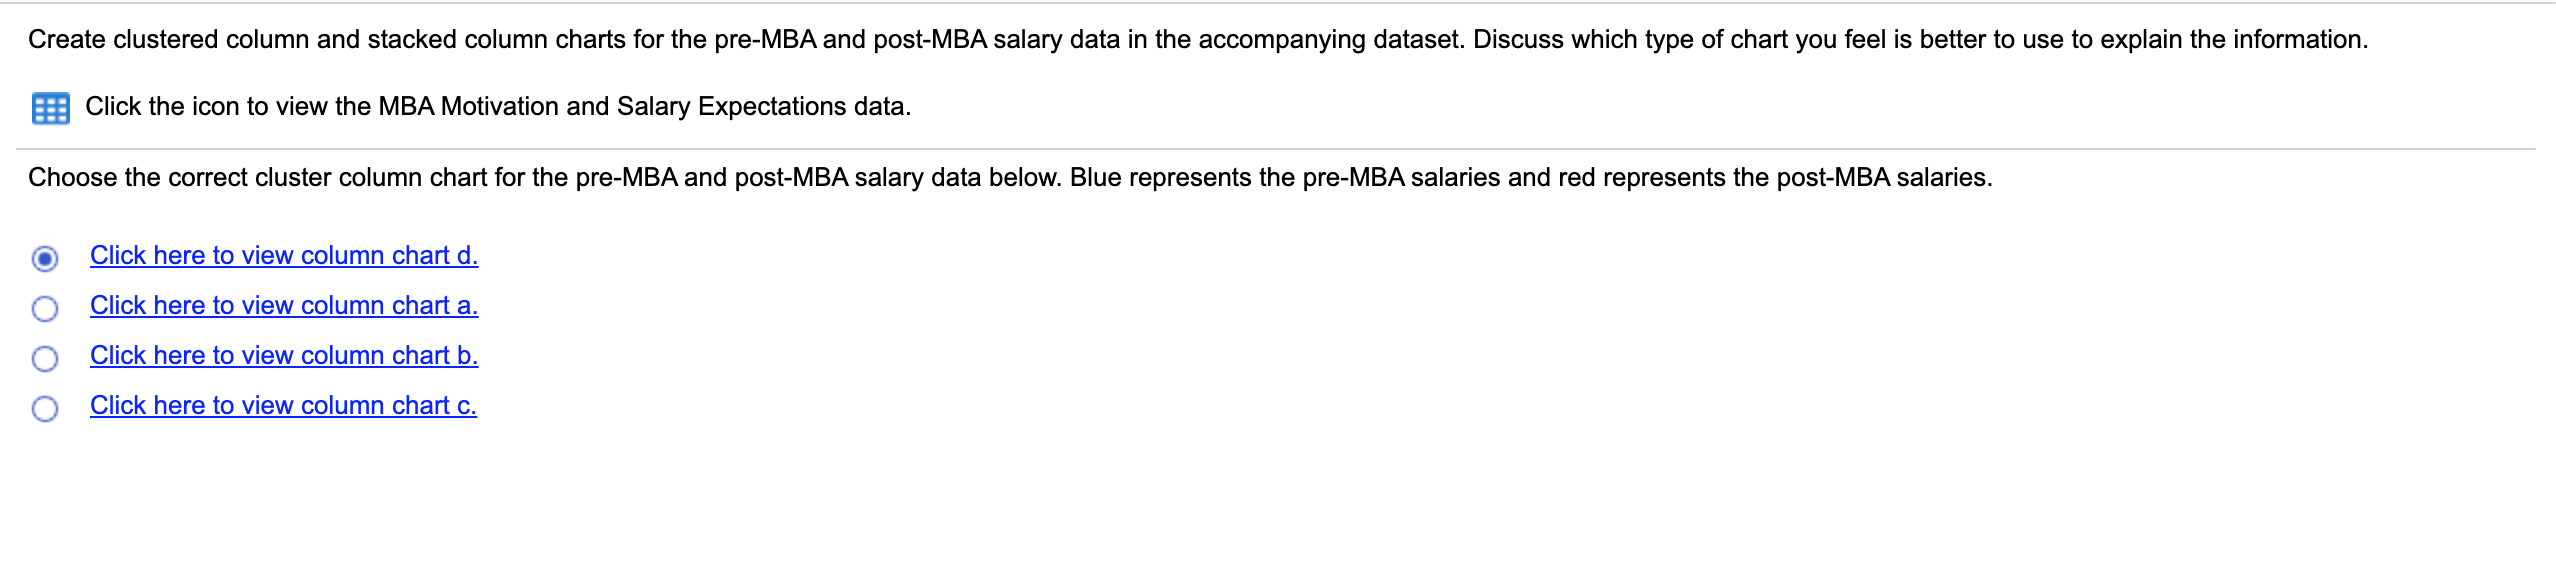
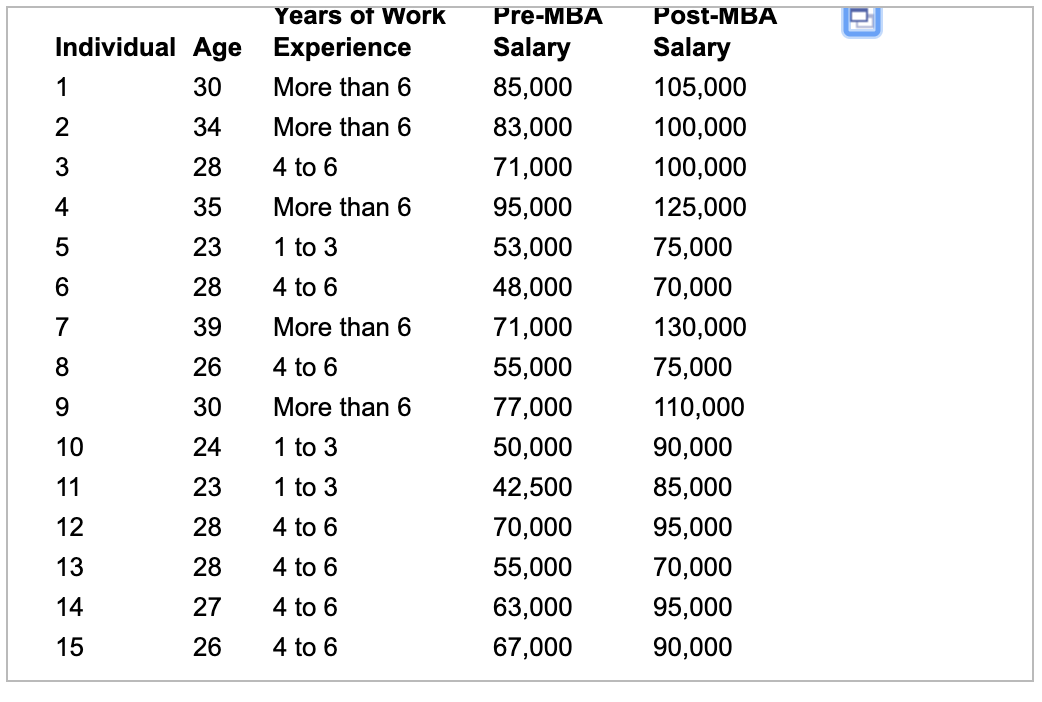
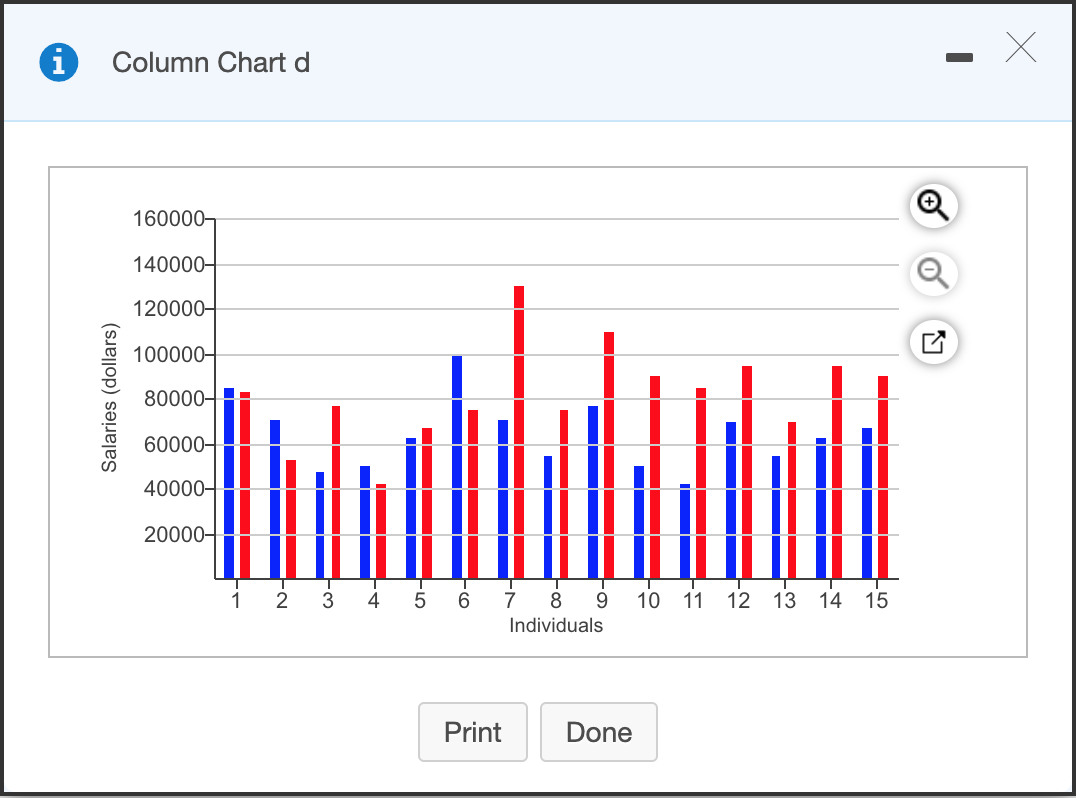
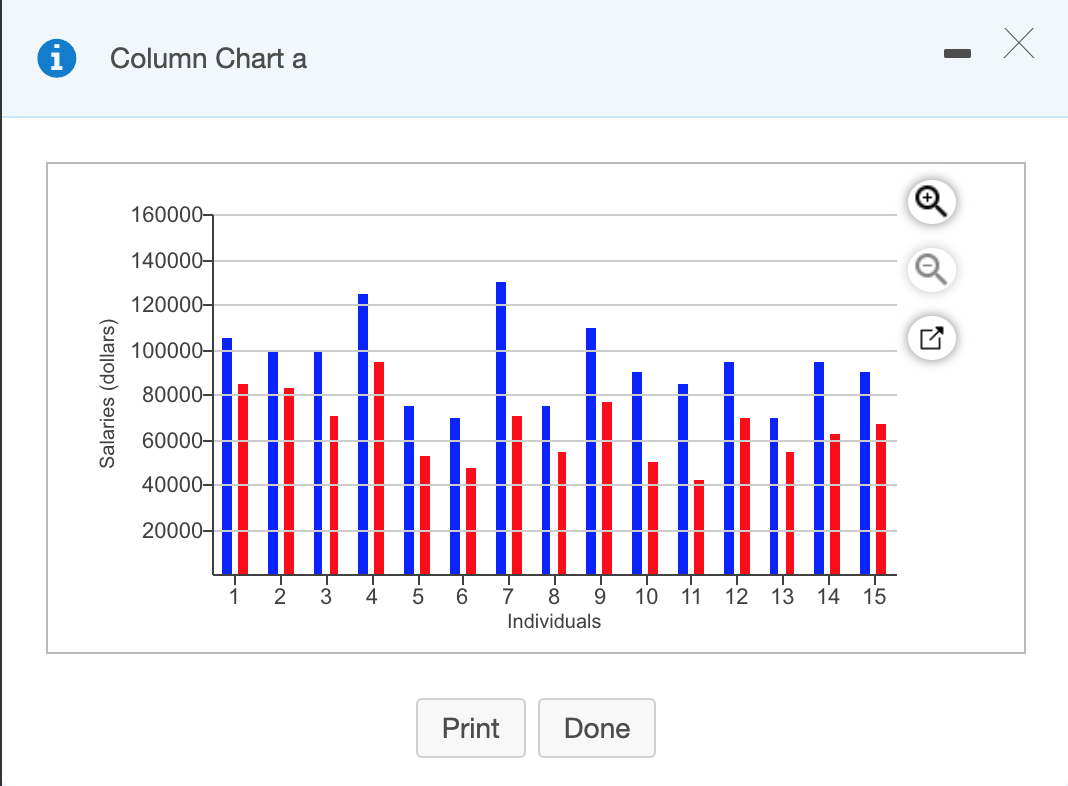
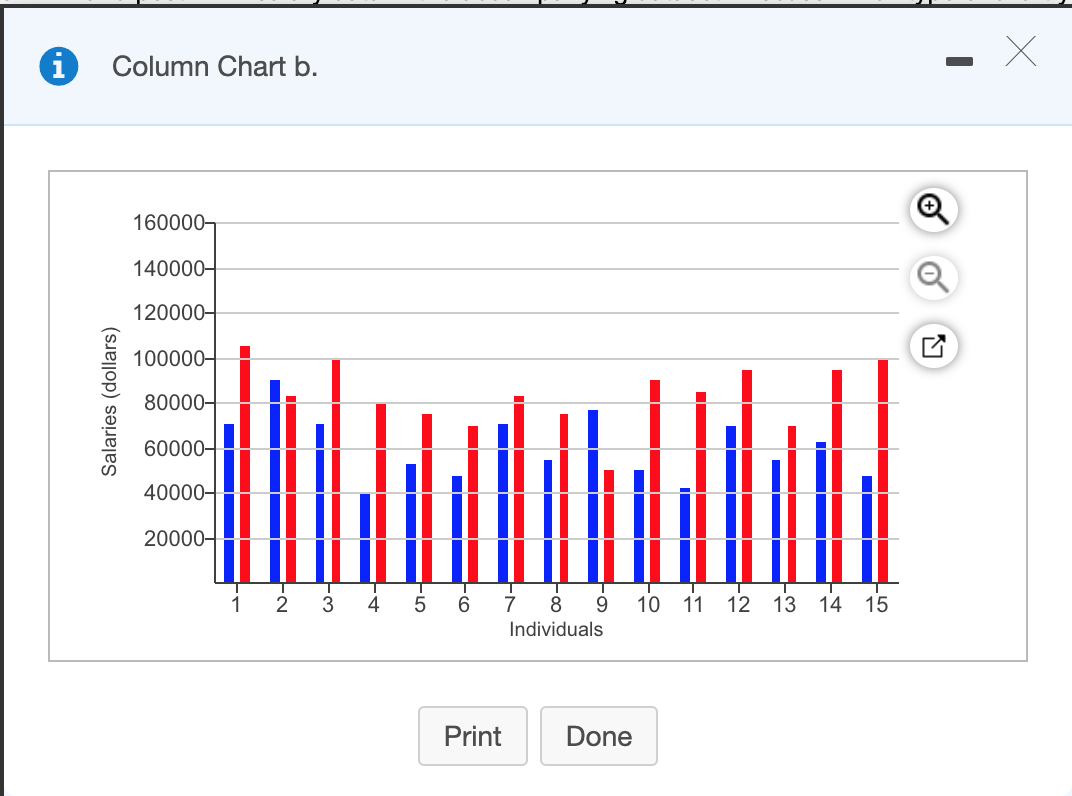
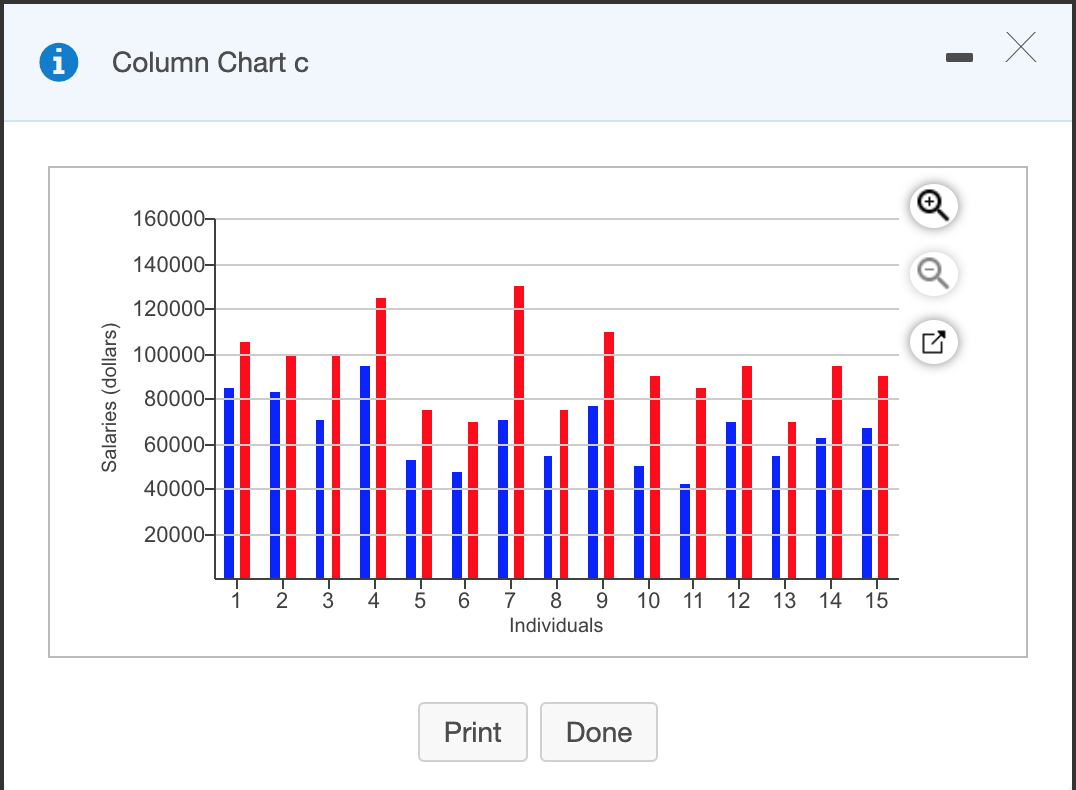
Create clustered column and stacked column charts for the pre-MBA and post-MBA salary data in the accompanying dataset. Discuss which type of chart you feel is better to use to explain the information. Click the icon to view the MBA Motivation and Salary Expectations data. Choose the correct cluster column chart for the pre-MBA and post-MBA salary data below. Blue represents the pre-MBA salaries and red represents the post-MBA salaries. Click here to view column chart d. Click here to view column chart a. Click here to view column chart b. Click here to view column chart c. Years of Work Individual Age Experience 30 More than 6 2 34 More than 6 3 28 4 to 6 More than 6 4 35 5 23 1 to 3 6 28 4 to 6 7 39 More than 6 Pre-MBA Salary 85,000 83,000 71,000 95,000 53,000 48,000 71,000 55,000 77,000 50,000 42,500 70,000 55,000 63,000 67,000 Post-MBA Salary 105,000 100,000 100,000 125,000 75,000 70,000 130,000 75,000 110,000 90,000 85,000 95,000 70,000 95,000 90,000 8 26 4 to 6 9 30 More than 6 10 24 1 to 3 11 23 1 to 3 12 28 13 28 4 to 6 4 to 6 4 to 6 4 to 6 14 27 15 26 Column Chart d Salaries (dollars) 4 10 11 12 13 14 15 g 9 Individuals Print Done Column Chart a 160000 140000- 120000 100000- Salaries (dollars) 80000- 60000 40000- 20000 N- W- 10 11 12 13 14 15 Individuals Print Done ? i Column Chart b. 160000 140000 120000- 100000- Salaries (dollars) 80000- 60000 40000 20000- 1 2 3 4 5 6 10 11 12 13 14 15 7 8 9 Individuals Print Done Column Chart c Salaries (dollars) 10 11 12 13 14 15 g 9 Individuals Print Done